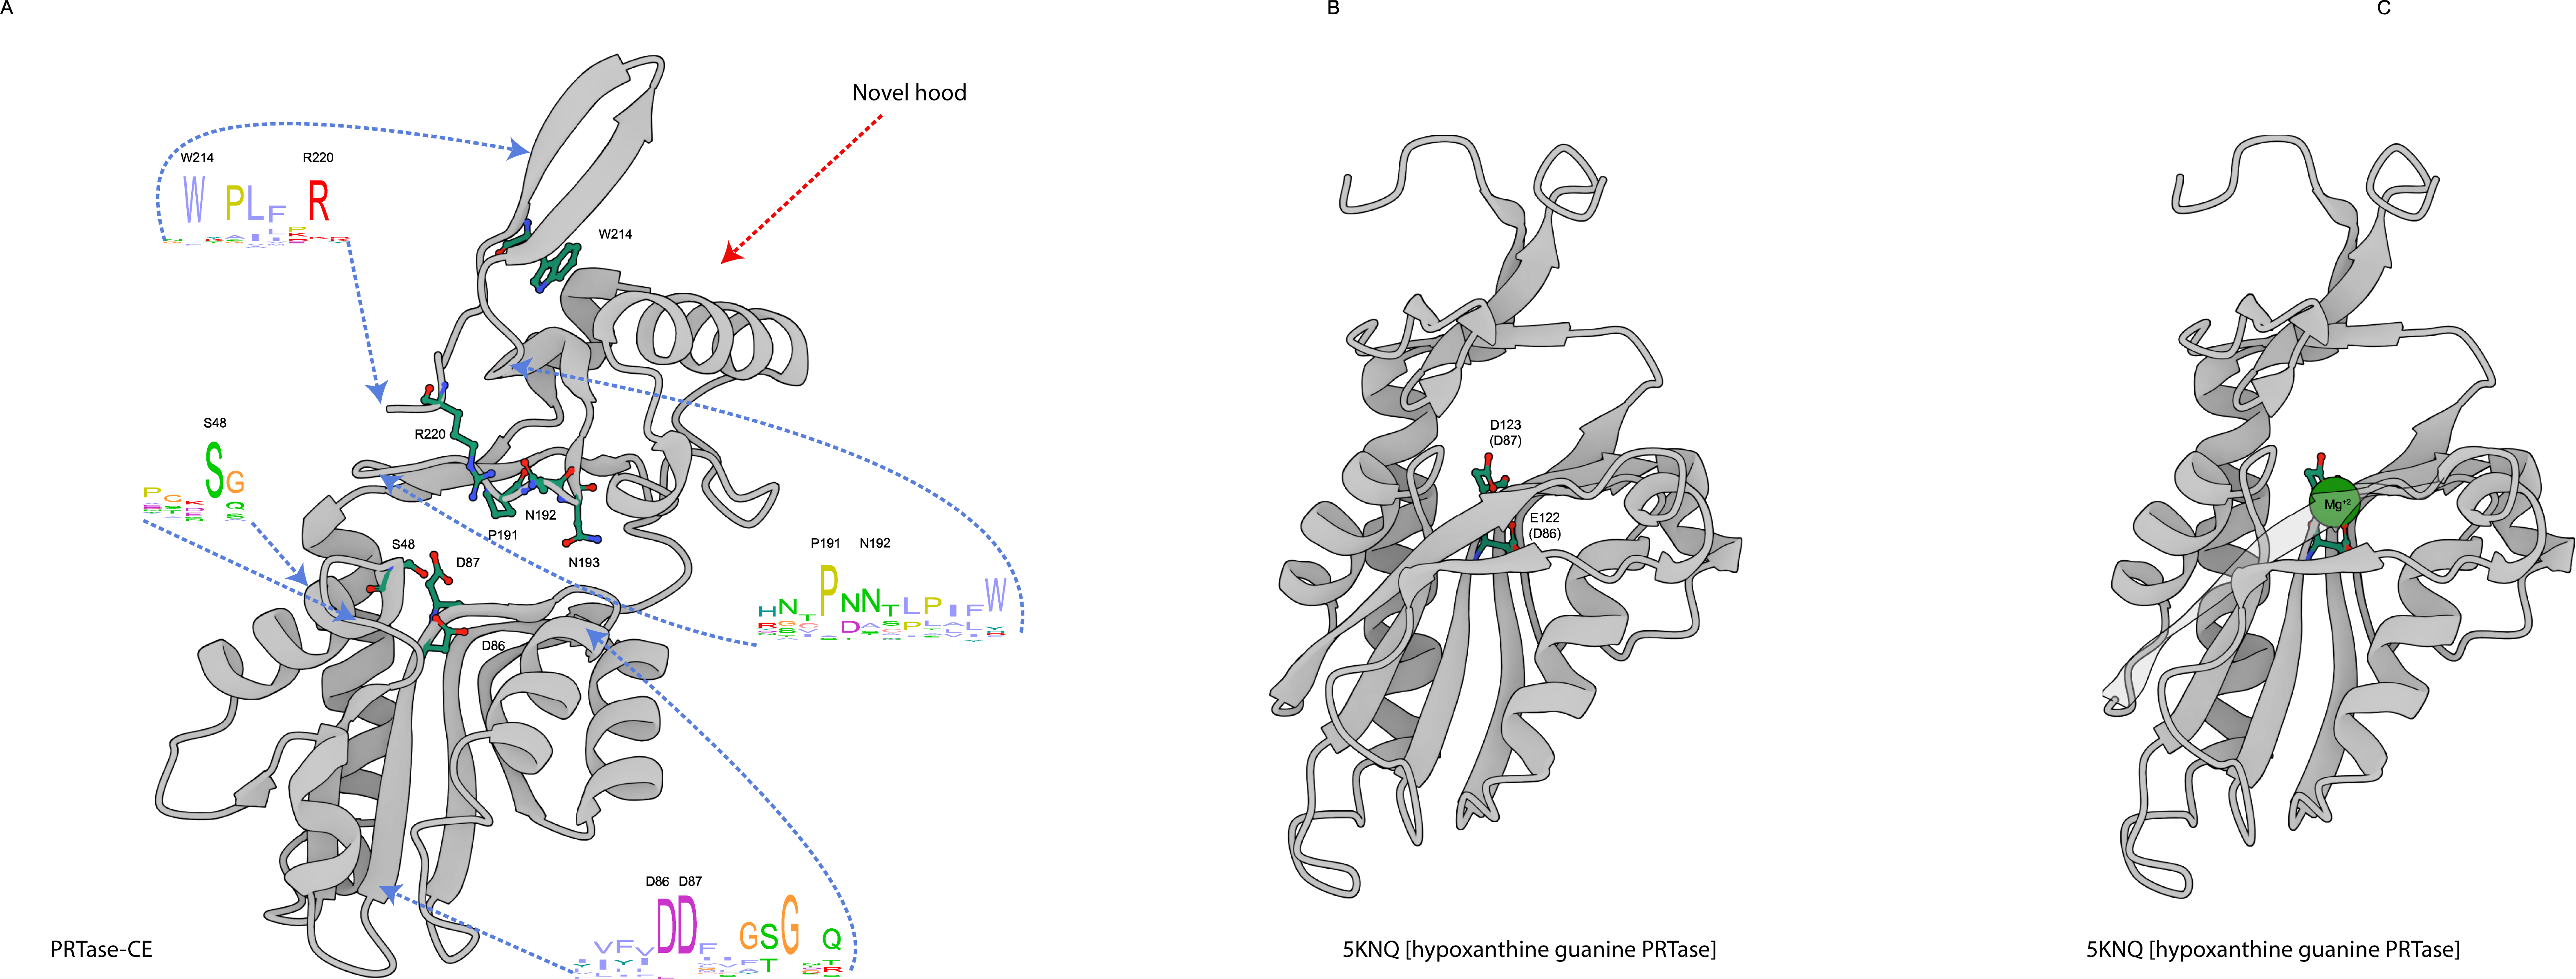
Supplementary Figure S7. Activity site and conserved residues
from the PRTase-CE domain. (A) Alphafold modeling of the
PRTase-CE domain (NPV02125.1). The residues conserved in the activity
sites are shown in ball and stick representations. Sequence logo of the
conserved regions are shown and the dotted lines indicate the start and
end position of the logo in the structural model. (B and C). Activity
site of the experimental crystallized PRTase domain from the PDB 5KNQ
without and with the Mg+2 ion respectively.